For the last year I have been volunteering on a City of Los Angeles citizen advisory task force that is studying alternatives to armed traffic enforcement.
It's called the LADOT Traffic Enforcement Advisory Task Force. You may have read an article in the Los Angeles Times about a draft of recommendations under consideration as we conclude our work.
As a nerd and technologist, the task force was attractive as an opportunity to brainstorm technological solutions to traffic enforcement as well as see how the application of geospatial data science provide insight into a contemporary social justice debate.
Not surprisingly given the events of 2020, there has been a rise of specialists studying police traffic stops as well as advocates who want to eliminate traffic enforcement by armed police.
One of the supporting 'facts' for eliminating traffic enforcement by armed police is the repeated discovery of disproportionate traffics stops in communities by using the perceived-race of the drivers as the differentiating factor. In other words, if the City of Los Angeles has a 10% population of Group A, then why does Group A show up disproportionally in traffic stops occurring in the city (e.g. 20% of all stops). It's a good question and one that needs to be respectfully researched.
There is, however, a flaw, as most data scientists will note almost instantly -- where stops are occurring and the population of that area determines the proportionality of a population represented in the stops. In a city as geographically large and diverse as Los Angeles, where something happens makes a big difference as to who is impacted. If traffic stops are happening more in a place, it's probably going to result in more of the population in that place being represented in the overall analysis.
Unfortunately, when this line or research was requested, our task force was told the stop data did not allow for precise geocoding of each stop's location. We were told that there was no latitude or longitude coordinates for the stops and that the addresses used were often too scarce in detail for address-based geocoding.
A review of the stop data confirmed both of these to be true. But it also revealed something else, the individual LAPD Reporting District where the stop occurred was recorded in the data. There was, in fact, a way to give the stop data a geographic location using whichever of the 2000+ LAPD Reporting Districts the stops occurred in.
In reviewing this with the experts hired by LADOT to aide the research, it was disappointing to hear that the consultant's subconsultant had not seen the ability to connect stop data to a map using LAPD's own Reporting Districts. To me this seemed like an obvious way to give stop data geographic certainty and explore possible correlations. Perhaps the consultants didn't recognize what Reporting District coding indicated. Thankfully, I was able to lend this technical insight to the research work.
After all, among the possible correlations to explore, was the location of street corridors identified for the reduction of traffic collisions and injuries. This program, known as Vision Zero, began under the last Mayoral administration. High injury and fatal-incident locations were targeted for increased traffic enforcement and consideration for prioritized funding on measure that might reduce collisions. There might be disproportionality based upon where these streets targeted for enforcement were located.
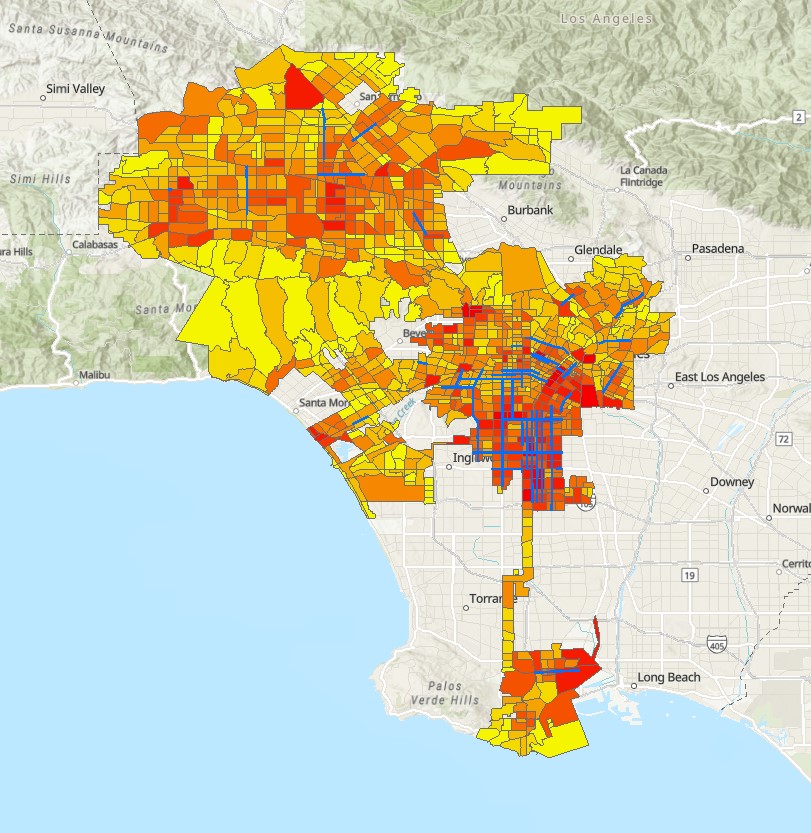
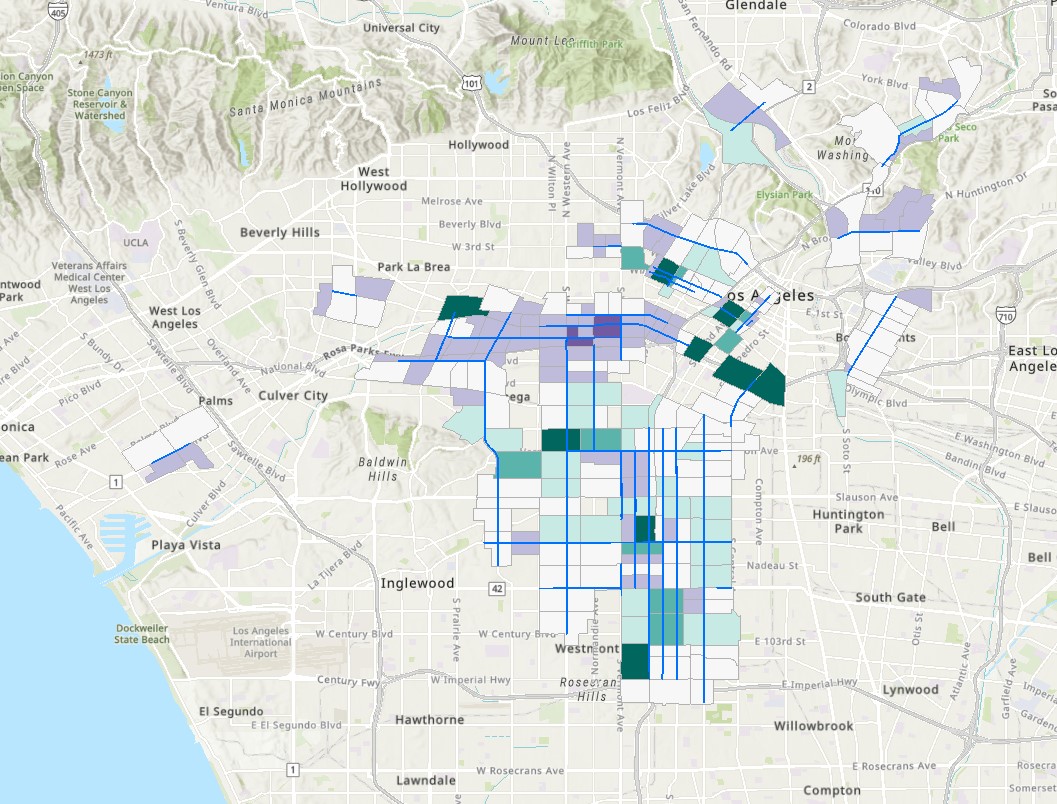
When I mapped the Vision Zero Corridors atop the a heat map of traffic stops by LAPD Reporting Districts, there was a near-immediate visual association of high numbers of traffic stops near the Vision Zero Corridors:
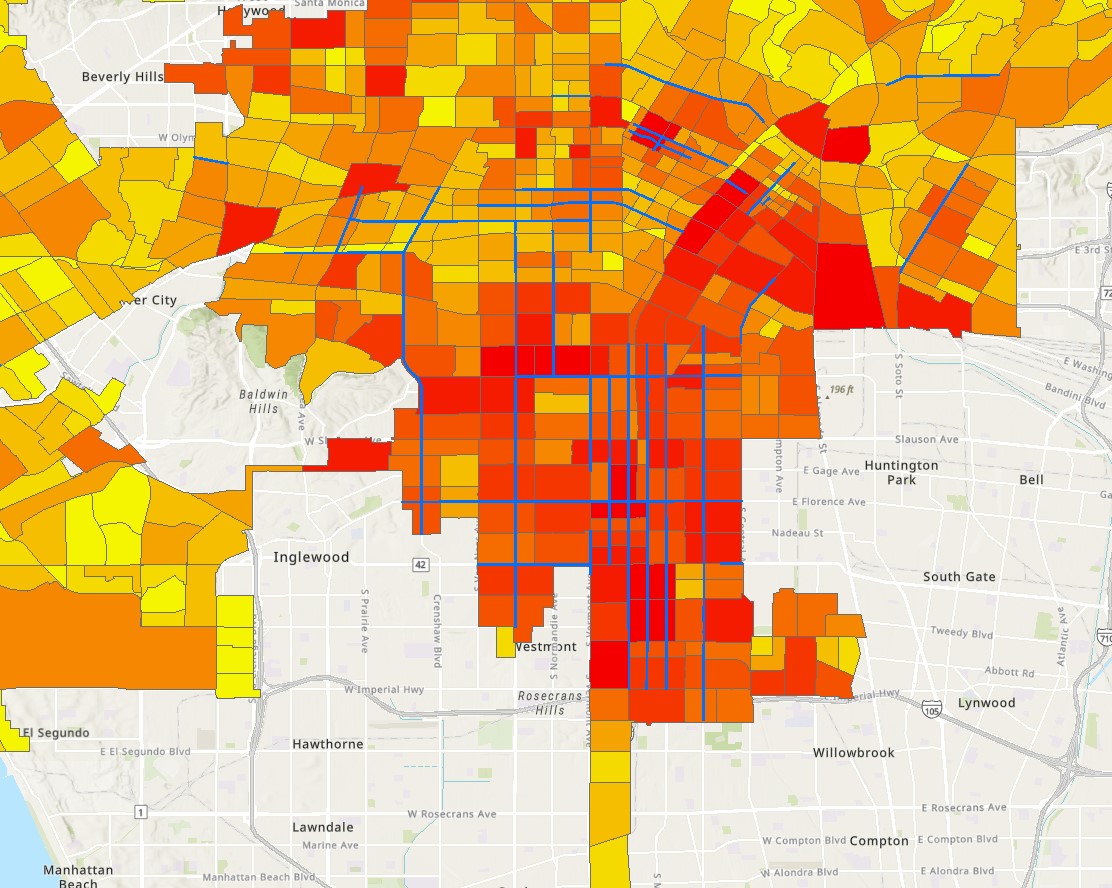
This is what one part of Los Angeles looked like with traffic stops evenly distributed the number of stops into one of ten equally sized buckets with dark red indicating the highest band of stops:
After altering the distribution to show ten buckets with equal ranges, and not necessarily an equal number of stops in each range, this is what a subsection of the above looked like:
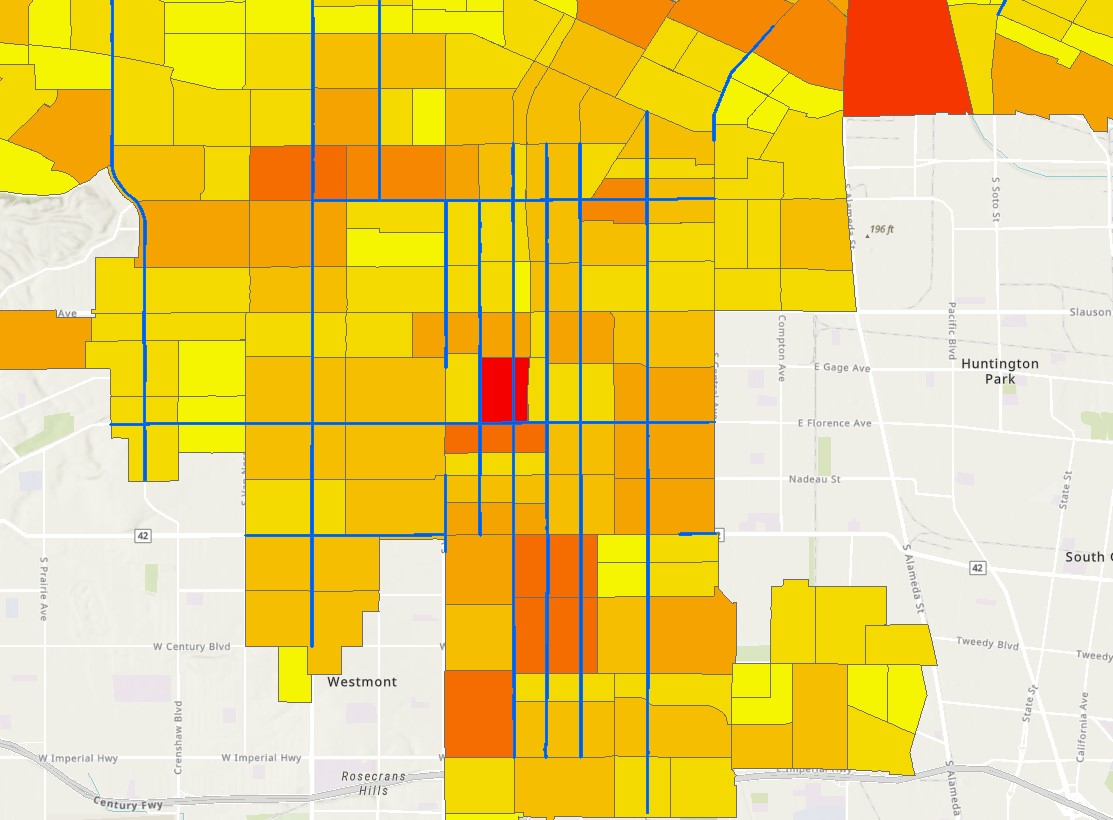
The red area in the above is the LAPD Reporting District with the highest number of traffic stops in the entire City of Los Angeles over the period of time studied. Right away, I noticed that it includes contact with at least three Vision Zero designated corridors. Check out the entire deck on this analysis here.
Does this prove any correlation between the number of stops in a LAPD Reporting District based upon that RD's contact with a Vision Zero Corridor? No.
That came in the next step -- connecting the location data on the concentrations of stops with the location data regarding those districts' contact with designated corridors for enforcement. Then run a correlation analysis.
Here's what I found:
The Coefficient of Determination (R-squared) between the frequency of traffic stops and location of Vision Zero Corridors in a Reporting District was 0.14 -- that means in Reporting Districts with Vision Zero Corridors there are 14% more traffic stops than in Reporting Districts without Vision Zero Corridors.
Why does all of this matter? Because claims of disproportionality in the number of stops based upon race is likely skewed by the location of stops in neighborhoods with populations that do not represent the overall complex diversity of the city as a whole.
For example, if the racial diversity of Los Angeles is 50% Latino, 25% Caucasian, 15% Asian, and 10% Black, can we expect that each LAPD Reporting District will have that exact distribution? No.
The above research strongly suggests that the population in Reporting Districts with Vision Zero Corridors is being stopped 14% more than populations in Reporting Districts without Vision Zero Corridors. That alone could impact disproportionality of stops by race when looking at diversity numbers citywide.
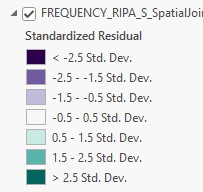
Also interesting were the variations among the number of stops in neighboring Reporting Districts shown here as standard deviations with colors corresponding to the above map:
This suggests there might be additional events contributing to the disproportionality of stops. Based upon literature review of traffic stop studies, it's my hypothesis that the location of reported crime is a factor in the number of traffic stops and that the location of fatal traffic collisions may also be a factor.
Further research is warranted and will include analysis of correlations between crime reports in an area and traffic stops in that area, as well as fatal traffic incidents in an area and the number of stops. All of that needs to them be compared to the diversity distribution of the individual LAPD RDs to see if disproportionality in stops using race as a distinguishing characteristic is related to where the stops are located and who lives in those areas.
