We analyzed Manhattan for lots using 25% or less of their by-right Commercial Floor Area Ratio.
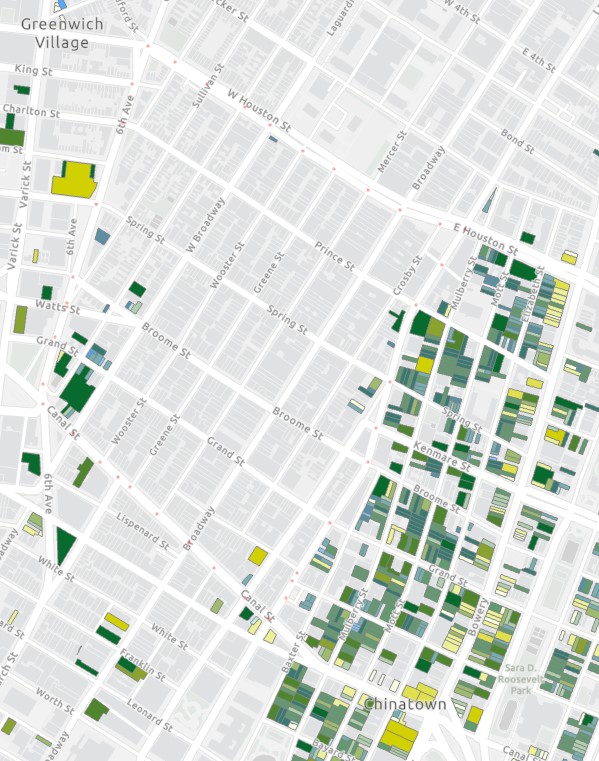
Then we partnered with Slice Consulting at Syracuse University who analyzed the location of events during New York's recent Tech Week to identify the three most popular neighborhood for Tech Week events -- SoHo (above), Midtown, and Flatiron.
This is what we call "targeteering" -- preparing in advance for opportunities by identifying the properties with the greatest possibly alignment to your development goals. This is just one example.
To learn more, get in touch.
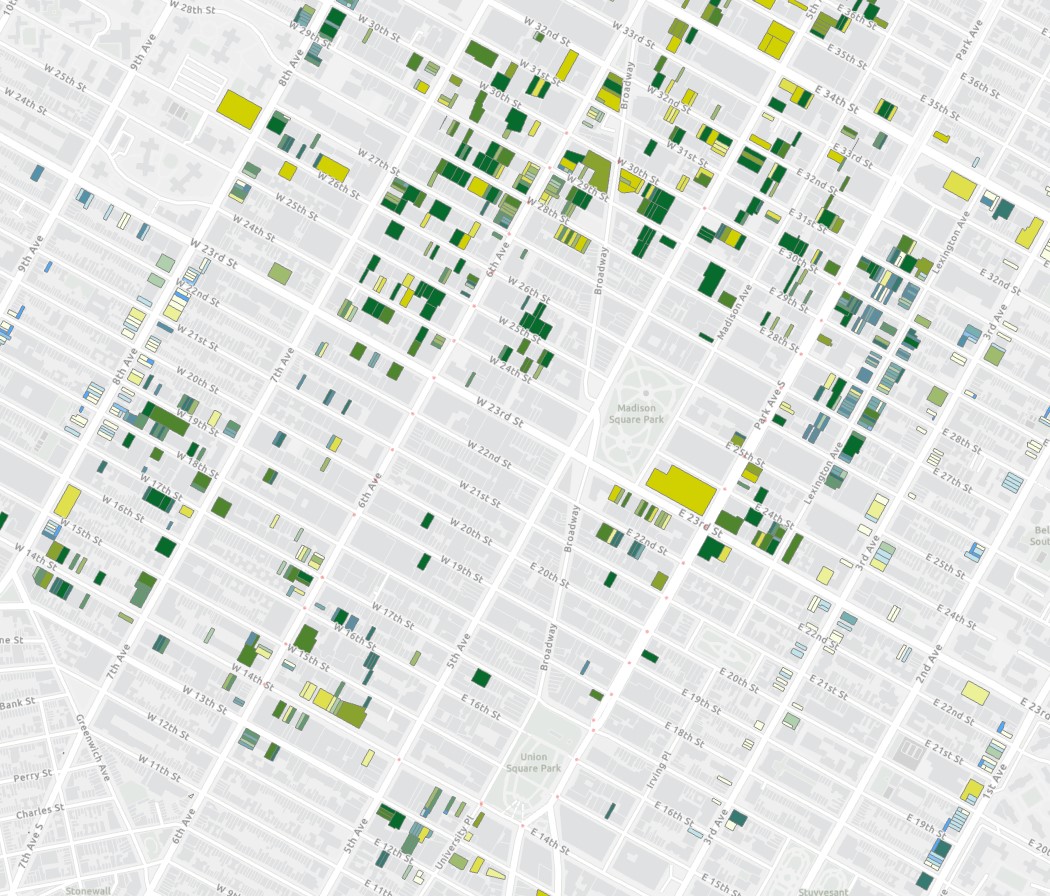
The legend to the map is:
Dark Green -- property with highest combination of unused CFAR as an amount and as a percentage
Dark Blue -- property with the highest unused CFAR as a percentage of its maximum by-right
Dark Yellow -- property with the highest unused CFAR as an amount in square feet
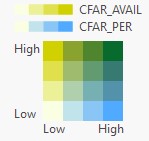
Here's the map of Midtown:
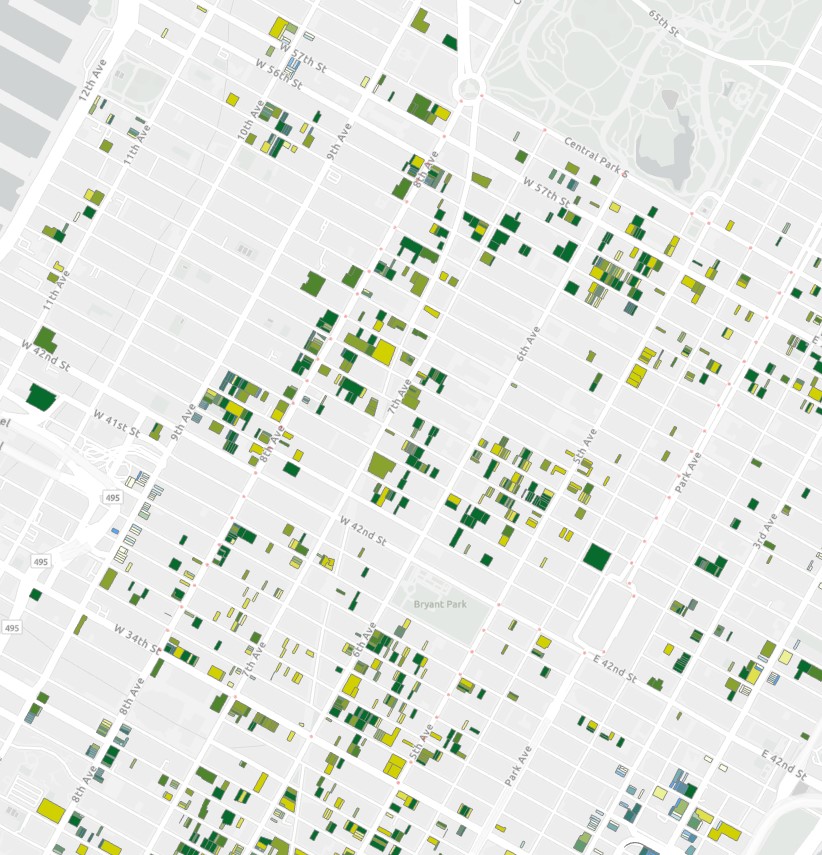
And Flatiron:
We relied upon data from the City of New York for zoning and CFAR ratio. Neighborhood boundaries were determined using The New York Times' extremely detailed map of New York City neighborhoods.
